
3 Hidden Expenses that Kill Deals
When buying a flip house or a value-add rental… “back of napkin math” on that property usually looks more profitable than the deal actually is. And not because of the obvious culprits like hidden repairs or a dip in the market.
What can really trip us up as investors are the hidden fees that come with buying, selling, and holding real estate.
In today’s newsletter we will go through a few of these together.
Then I will show you how just two of these costs can absolutely demolish a deal that originally looked good on the MLS.
Debt service/lender closing costs: If you are funding a flip with hard money or a “fix and flip loan” many times the lender will charge close to 5% of ARV on the deal. How?
Between paying “points” at closing, interest payments during the project, and other fees…you can expect to pay almost 7% of ARV in total debt service costs… especially if they require things like a survey or an appraisal!
Sales commissions: For a flip, if you are listing on the MLS, you will usually lose about 5% of your ARV to agent commissions. That’s just to pay the buying and selling agents their commission, and the seller foots the bill!
Increased Property Tax Assessments: For a “buy and hold” or rental property. You may have forecasted your PITI (monthly payment) to stay the same for the life of the loan, especially on a fixed rate mortgage.
Although the interest rate is locked on a fixed rate loan, insurance and property taxes are not. Insurance premiums (especially in FL) are known to fluctuate, but few people factor in the increased costs of property taxes when the property is re-assessed following a sale.
The rates and methodologies of how this is done vary in each state, county, and city. So I would contact the assessor’s office in your town to better understand how property taxes may be affected in the year after purchase.
As an example…In Texas, (where property taxes are assessed every year) we had a property go from a monthly NOI of $700 to $300 just from increased property tax assessments. (Ouch!!)
Okay, now that you know the 3 hidden costs let’s see what just 2 of them can do to a potential flip.
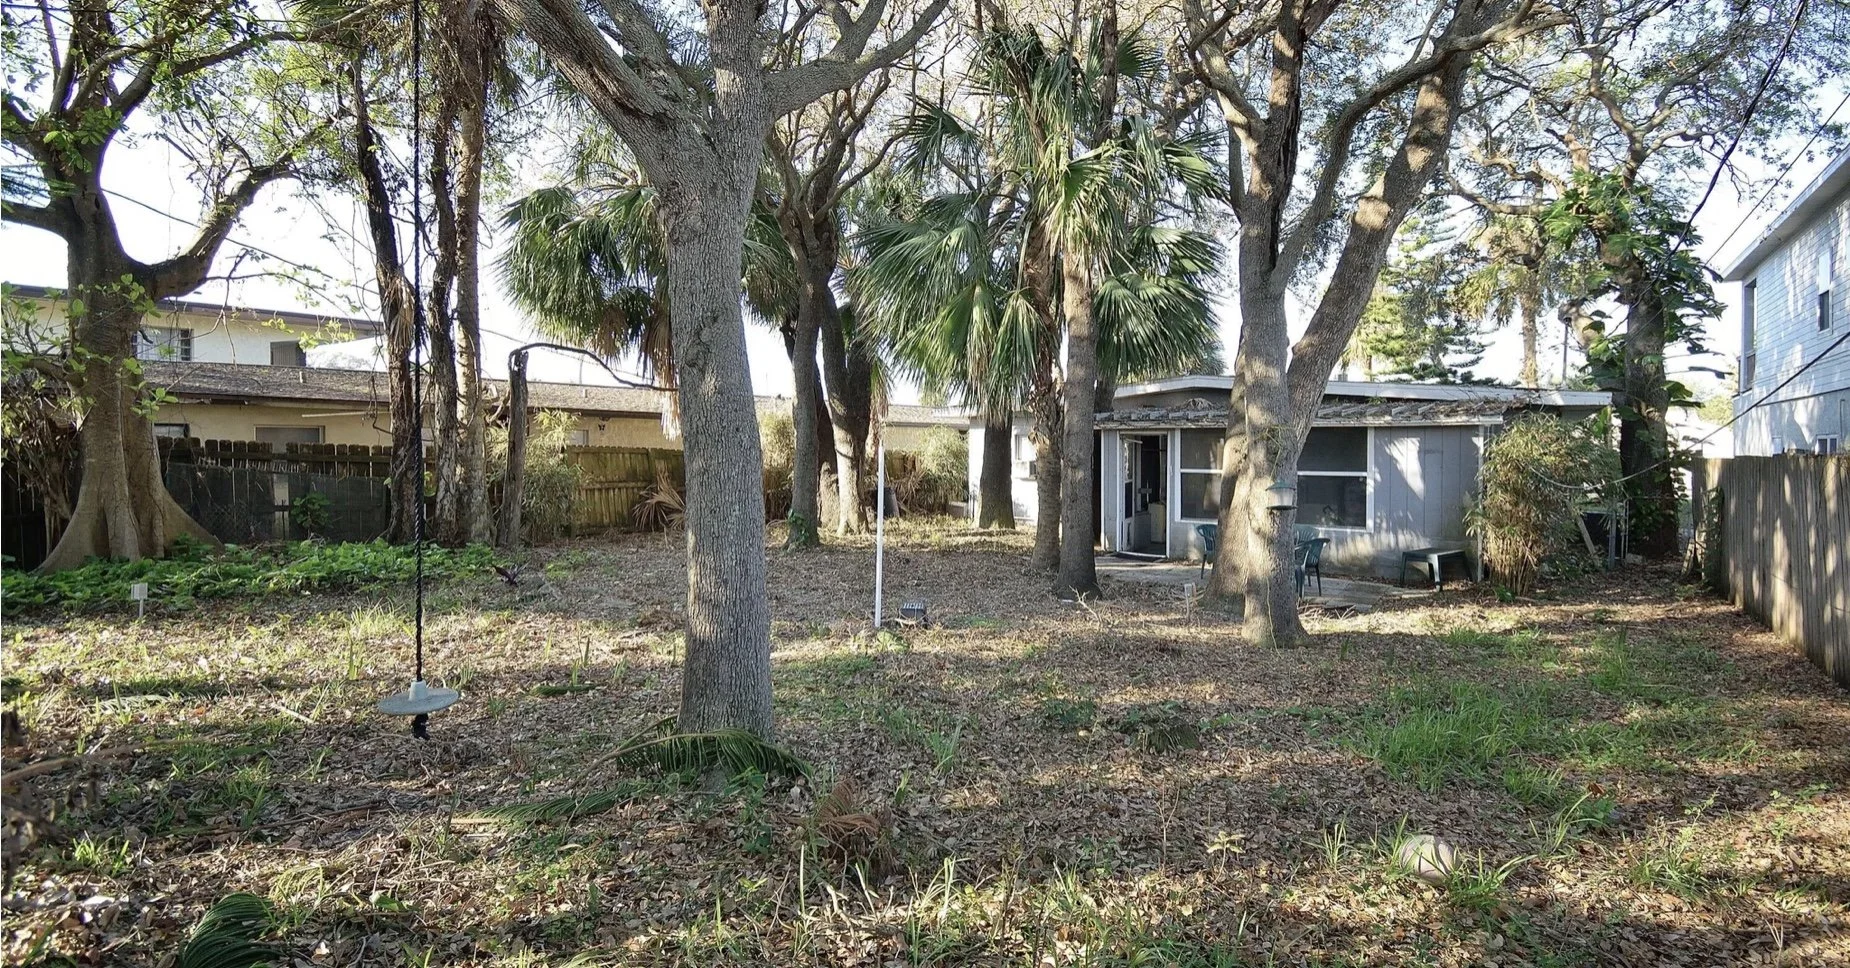
Here’s 3/2 in Satellite Beach that recently went under contract. Before it did, I analyzed the house to see if it’s something I could flip.

Subject property
First, let do some back of napkin math the way an experienced investor might… NOT factoring in the hidden fees we just discussed.
Asking price: $360,000
Repair Costs: $80,000
ARV: $500,000
Profit: $60,000
Looks OK right?? 60k proft? That’s over 10% of ARV (our target)… so should we make a full price offer?.... Not so fast.
Here’s how the deal looks after adding in our (often-overlooked) expenses.
Asking price: $360,000
Repair Costs: $80,000
Debt Service: $32,000
(2% points, 6 months of interest payments, other closing costs)
Agent Commissions: $25,000
2.5% per side, buyer/seller
ARV: $500,000
Profit: $3,000 (Ouch!!)
In the past couple years, I have seen investors dive into deals with almost no due diligence and the market has bailed them out.
In the deal above, you could still make money overlooking those extra costs if your ARV went from 600 to 650 in the 6 months you spent fixing it up. That’s essentially what was happening during 2021.
But supply is up 3x since then, and rates are double. In my opinion there still more opportunity now than the last two years, but profitable deals are going to come more in the form of buying low instead of market tailwinds.
So let’s not forget these hidden fees, and get out there and find deals that make sense and make offers!
-Levi
Thank you for taking the time to read, if you know anyone else who is interested in investing in Brevard Real Estate please invite them to subscribe by sharing this or any of our other newsletters. If you are not subscribed yet, you can do so here.
Want to work with me and my team? Here are some ways we can partner together:
Short Term Rental Property Management: Ocean Blou Properties
Long Term Rental Property Management: IGC Rents
Sales Associate with IGC Realty: Levi@IGCrents.com or 7194521225
How to Buy a Flip House Using the 70% Rule
Shopping for your next flip house? Here’s a simple metric that I use to tell you what to pay.
There’s a lot of things to calculate before going in on a flip… construction costs, holding costs, closing costs, agent commissions, and even utility costs during the construction. Despite all of these, I’ve found a simple formula to help me shoot out lots of offers to help me find out where the motivated sellers are!
It’s called the 70% rule: ARV– 30% - Repair Costs = My Offer
In flipping, you make money when you buy not when you sell. Because of this, you need analyze properties quickly and make offers frequently. That is where the 70% rule comes in.
Let’s break down each part of the formula and then analyze a property I went under contract on last week.
What is ARV? ARV stands for “after repair value” this is how much the property will be worth when the repairs are done. The best way to calculate ARV is to pull comparable sales, look at sold listings (not for sale or under contract) that are like the subject property, and adjusting for any differences. Keep in mind interest rates are roughly double what they were earlier this year, so the more recent the sale the better.
Why 30%? Your 30% deduction from ARV can be broken down by 10/10/10
10% holding costs and sales commissions
10% funding costs (interest, closing costs and points)
10% your profit
What about Repairs? This can be the biggest hang up for newer investors, I like to estimate on the high side then refine my numbers during the inspection process. If you shoot high on the repairs, your profit will simply be higher. Keep in mind, the more projects you do, the more accurate your repair cost estimates will be. Calling different trades for pricing and finding mentors that do similar projects in your market can be the most helpful initially. Eventually you may be able to build your own repair calculator from past projects and calculate by square foot.
Now let’s look at the 70% principle in action, here’s a 2/2 bungalow in Cocoa Beach we just went under contract on.
ARV: 575
Profit, funding, holding + sales: -172,500 (-30%)
Repairs: 55,000
Offer: 347,500
In this case, a deep dive of the financing and cost breakdown allowed us to accept a 362k counter and still project a profit north of 50k. But we always like to start with the 70% rule to see if the deal is CLOSE, and then dig deeper to come up with a final number. Also, in full transparency, self-representing as an agent (collecting commissions on buy and sale) allowed me to go slightly above my typical criteria to make this deal happen.
How many offers have you made this week? I challenge everyone reading this to start using the 70% rule and start making offers in your market. I am available to help if you are interested in taking on a project in Brevard.
Sometimes not finding a deal is as simple as being too afraid to ask.
“You do not have because you do not ask…” James 4:2
Thank you for taking the time to read, if you know anyone else who is interested in investing in Brevard Real Estate please invite them to subscribe by sharing this or any of our other newsletters. If you are not subscribed yet, you can do so here.
Want to work with me and my team? Here are some ways we can partner together:
Short Term Rental Property Management: Ocean Blou Properties
Long Term Rental Property Management: IGC Rents
Sales Associate with IGC Realty: Levi@IGCrents.com or 7194521225

Should I Buy A Long-Term or Short-Term Rental? (And Let’s Analyze Some Listings!)
The business of LTR’s and STR’s are actually quite different. Which makes sense for you as an owner?

A common question we get from investors is whether to rent as a long-term (LTR) or short-term rental (STR)?
Firstly, as a side note, Brevard County is a rare market and accommodates both… this is unusual. Homes in high tourism areas are usually too expensive to cash flow as an LTR. (Sale price to market rent ratios are usually not favorable in those areas)
But Brevard has both high tourism and a reasonable median home price…along with a solid base of full-time residents and a strong job market.
There are multiple things to consider when choosing STR or LTR, such as do you want to use the property for personal use part of the year, as well as other personal considerations.
However, in today’s blog we will be ignoring those kinds of considerations and focusing almost exclusively on Net Operating Income. (NOI)
To get things kicked off, let’s go through some of the pros and cons of STR and LTR.
LTR:
-Full rent potential collected from month #1. (STR’s usually take 3-9 months to build up reviews and reach occupancy potential)
-Considerably less work to manage and cheaper management costs. (8% vs. 20-30% of revenue for STR)
-Perform property maintenance with tenants occupying property vs. blocking off bookings for repairs. (a double expense)
-No fear of HOA or city restrictions affecting bottom line.
-Use rent to offset DTI for future purchases.
-Less upfront cost, no need to buy furniture or stock household items. (Cookware, toilet paper, toiletries, towels, bedding, can really add up!)
-Guest reviews are not a factor in vacancy risk or rent potential.
STR:
-Higher revenue!! (Roughly double or triple in the Cocoa Beach market on average)
-More frequent opportunity to inspect your property. (Inspect your home for damage every week versus quarterly or longer)
-Potentially less money down on purchases. (Second home mortgages can sometimes qualify for buying STR’s)
-Increasing revenue over time. (Good reviews build exposure which lead to more bookings at a higher nightly rate)
-Raise “rent” dynamically to follow demand vs. every 12 months on standard lease.
-Make additional revenue from cleaning fees, pool heater fees, or even “admin” fees. (If they will pay it, you can charge it… although high fees can hurt bookings)
As you can see, there are a lot of factors to the advantages/disadvantages of STR’s or LTR’s.
As a whole, you should know that STR’s are not as “recession proof” as LTR’s as the family vacation is less critical than a roof over that family’s head when times get tough. But on the flip side, with STR’s you can “outcompete” other units and have more influence on the performance of your asset.
Now, let’s look at a few active listings and run a cashflow analysis on each, as a STR or LTR:

Property #1
2/1 in Eau Gallie Art District of Melbourne, FL (Under contract @ $250k but accepting backups)
This is a cute, (mostly) updated house near Indian River in the up-and-coming Eau Gallie art district. Homes in this area can support both LTR’s and STR’s due to its relatively low price point and tourism being near a walkabout historic area near the river.
First, let’s run through our costs/expenses.
PITI with 20% down: $1,595/ month (7.2% interest)
Cash in deal:
- $55k as LTR (down payment + closing costs)
- $70k as STR, (down payment, closing costs, furniture, and amenities)
Estimated rent/bookings potential:
- LTR: $23,184/year (net rent collected after PM fees)
- STR: $28,800/year (net revenue after Airbnb fees, and PM fees)
Note: this an estimate based on AirDNA data and underwritten based on average occupancy and nearby STR’s. Actual performance varies.
Cash on cash returns compared:
LTR:
$55k “cash in deal”
Holding costs: $19,140/year (PITI)
Rent Potential: $23,184 (after PM)
Annual NOI: $4,044 (7.3% cash on cash return)
STR:
$70K “cash in deal”
Holding costs: $19,140/year (PITI)
Bookings potential: $28,800* (after PM)
This is based on a 20% fee for STR property management.
STR management can vary in cost, this is on the low end of average costs and it’s a good idea to get a quote prior to closing on a house you plan to use as a STR. Average fees can be 30-35% depending on the specific market.
Annual NOI: $9,660 (14% cash on cash return)
Cap rates compared:
LTR: 9.2%
STR: 11.5%
Bottom line: STR is clearly the winner here for NOI, as an 14% Cash on Cash is a strong return for today’s rates. Even after paying 20% of booking fees for PM, buying furniture, and 3%+ listings fees to Airbnb. (All of which are tax deductible) But with that said, this is an acceptable return for some as a LTR especially considering today’s rates.
These cash-on-cash numbers would be substantially better with even a 5% interest rate. (Around 18% for STR) But I would not recommend buying a deal based on interest rate speculation.
Personally, I’m happy for the buyer’s here (I think they bought right) and I would keep an eye on this one in case it falls out of contract!

Property #2
3 BR 2 BA SFH in Merritt Island with Studio Apartment in backyard. (Asking 340k)
This house is currently being used as an STR, and even comes with future bookings. Merritt Island is not what I would typically think of as a vacation rental market, but it is centrally located and has bookings on the calendar. It also has a second unit in the backyard which we will include in our rent potential for our LTR analysis. I will underwrite this property based on a $320k sale price, as this is a somewhat stale listing and times have changed in the market.
PITI with 20% down: $2,049/ month (7.2% interest, $320k sale price)
Cash in deal:
$70k as LTR (down payment + closing costs)
$70k as STR, (furniture is already included)
Estimated rent/bookings potential:
LTR: $25,200/year (net rent collected after PM fees)
Breakdown: Main house $1,600/month, $700 for apartment (estimated)
STR: $32,400/year (net revenue after Airbnb fees, and PM fees)
Note: this an estimate based on AirDNA data and underwritten based on average occupancy and nearby STR’s. Actual performance varies. I have this on the low end of estimates ($180/night, 70% occupancy) due to its location. (B- neighborhood)
Again, STR management fees vary and 20% may be on the low end. Verify first!
Cash on cash returns compared:
LTR
$70k “cash in deal”
Holding costs: $24,588/year (PITI)
Rent Potential: $25,392 (after PM)
Annual NOI: $804 (1.1% cash on cash return, OUCH!)
STR
$70K “cash in deal”
Holding costs: $24,588/year (PITI)
Bookings potential: $32,400* (after PM)
*This is based on Ocean Blou’s fee structure
Annual NOI: $7,812 (11% cash on cash return)
Cap rates compared:
LTR: 7.9%
STR: 10%
Bottom line: Obviously not viable as an LTR, the only real monetization model for this asset (at today’s rates) is STR. Even so, the returns/performance we calculated here (in year one) are in a sense inflated because the property comes furnished. This deal isn’t appealing to me.
Despite the future bookings, the property also does not come with any reviews on Airbnb or VRBO (I checked). So, taking over this “turnkey STR” will be a lot like starting from scratch in this aspect. But this is a great example of how many deals on MLS don’t make *any* cashflow as an LTR with current rates and sellers are still in the beginning stages of understanding this.
As a side note, to follow the “minimum $350/month cashflow rule” some RE gurus recommend (and I agree with) you would need to pay $265kfor this property! It’s listed at 340k, so that’s a 22% price reduction just to obtain minimum cash flow!
Thank you for taking the time to read, if you know anyone else who is interested in investing in Brevard Real Estate please invite them to subscribe by sharing this or any of our other newsletters. If you are not subscribed yet, you can do so here.
Want to work with me and my team? Here are some ways we can partner together:
Short Term Rental Property Management: Ocean Blou Properties
Long Term Rental Property Management: IGC Rents
Sales Associate with IGC Realty: Levi@IGCrents.com or 7194521225

Current State of the Market- Special Multifamily Edition!
Things are changing quickly in the Brevard market; interest rates are up to over 6% and total inventory is up almost 3x from last year.
Although pricing has started to decline as well, values are holding relatively well compared to many other markets, especially in the more desirable areas of our county. Remarkably sub 800k properties in Cocoa Beach (where I buy) are as scarce as ever.
This is a very exciting time for investors, we don’t pay list price anyways, so motivated sellers have always been more important to us than big price drops. (Although there are some of those too)
That’s why you will see that the properties on this newsletter are “analyzed” at prices below asking price, many sellers feel that this is their last chance to sell with the uncertainty of market, and the “fear narrative” is making it easier to acquire great assets with a lower cost basis than past months.
I invest here because I think Brevard will fare well in the coming recession, as our economy is built on more “recession proof” industries such as aerospace…also our constrained supply (coastal) has amplified the effects of increased demand.
Here are a few potential opportunities I’ve noticed in the past days, underwritten at conservative rent estimates that matches our current climate. Many have “value add opportunity” and please know that with me you have access to the best property managers for both short- and long-term rentals in the area. (IGC for LTR, Ocean Blou for STR’s) We strive to keep you an investor and not a landlord. We can also help facilitate any construction needs to maximize yield on these exciting cash-producing assets.
This week we are focuseing on multi-family, but there are many opportunities in single family rentals as well. (And a lot more to choose from)

Opportunity #1
7 units, LTR or STR opportunity in South Cocoa Beach
7 unit property South Cocoa Beach, (asking 1.35 million)
Unit Breakdown:
5 studios
1 (2/1’s)
1 (1/1’s)
Gross Rent Potential: 10k/month (5 STR on studios, 2 LTR’s with PM)
Potential offer: 1 million (26% reduction)
Repair/furniture costs: $75k
Cost basis: 1,175,000 (including closing costs and repairs)
Un-levered yield on capitol with full property management: 10.2%
Levered yield with 20% down: $50,016 / $375,000 = 13% cash on cash
Bottom line: Solid returns for higher potential appreciation area. (Beachside) Minimum construction downtime, but STR’s do take a little longer to build up occupancy and thus cashflows.

Opportunity #2
2 Units, LTR opportunity in Rockledge, FL
Unit Breakdown: Duplex, 2/2 on each side
Gross Rent Potential: $3200/mo
Potential offer: $300k
Repair costs: $50k
Cost basis: $350k
Un-levered yield on capitol with full property management: 10%
Levered yield with 20% down: 12%
Bottom line: Solid moderate range duplex that should have minimum Capex due to fairly new construction and budgeted initial repairs. Good price range for working class families that tends to have lower vacancy. May be opportunity cash out re fi after improvements are made if capital return is desired.

Opportunity #3
2 Units, LTR opportunity in Indialantic, FL (Beachside)
Unit Breakdown: Duplex, 2/1 on each side
Gross Rent Potential: $4200/mo
Potential offer: $475,000
Repair costs: $10k
Cost basis: $495k
Un-levered yield on capitol with full property management: 9%
Levered yield with 20% down: 8.6% (year one lower due to repairs + closing costs)
Bottom Line: Highly desirable location, but lack of STR opportunity (city restrictions) makes cashflows less than “lower potential appreciation” markets. With that said, property is relatively turn key and a future “re-rate” could really increase cashflows while holding RE in one of the most desirable areas in Brevard. (Of course, there is no guarantee rates will go down)
Thank you for taking the time to read, if you know anyone else who is interested in investing in Brevard Real Estate please invite them to subscribe by sharing this or any of our other newsletters. If you are not subscribed yet, you can do so here.
Want to work with me and my team? Here are some ways we can partner together:
Short Term Rental Property Management: Ocean Blou Properties
Long Term Rental Property Management: IGC Rents
Sales Associate with IGC Realty: Levi@IGCrents.com or 7194521225